
Sussex SU election turnout is better than last year… by just 0.8 per cent
It was still appallingly low
The Sussex Students’ Union elections have now finally ended. No more will you have to avoid the human obstacle course in Library Square made up of pushy candidates, armed to the teeth with crudely designed flyers. But, whilst candidates and the SU have pestered students to vote, it seems as if it was all a bit pointless as the turnout for the elections only just beats last year’s dismal 17.1 per cent turnout.
Using the statistics and numbers provided by the Students’ Union, we can reveal that only 17.9 per cent of students actually decided to come out to vote. Despite the increased numbers of students attending Sussex this year compared to last year, the actual number of students who have voted was barely more than last year.
The number of students who voted actually increased by 11 per cent but when compared to the increased number of students from the year before the turnout overall increased by 0.8 per cent.
Last year, Only 3,043 of the 17,803 current students (according to the Students’ Union website) at University participated in the student elections — a turnout rate of just 17.1 per cent. This year, 3346 out of 18652 came out to vote – a turnout rate of 17.9 per cent.
Frida Gustafsson was re-elected as SU-President with 861 out of 2784 votes, meaning that she received 30.9 per cent of the votes. Her policies focus on Better Bars, Better Campus, Better Union.
Breakdown of past Students’ Union election voter turnouts
2018
3346 voters, 18652 students (17.9 per cent)
2017
3,043 voters, 17,803 students (17.1 per cent)
2016
3,601 voters, 15,433 students (23.3 per cent)
2015
4,725 voters, 13,725 students (34.4 per cent)
2014
4,411 voters, 13,868 students (31.8 per cent)
2013
3,866 voters, 13,103 students (29.5 per cent)
2012
3,511 voters, 13,166 students (26.7 per cent)
The SU has been approached for comment

Sussex Uni introduces compulsory office wear in library to prepare students for employment
A leaked email explained students would be denied entry to the library if they didn’t dress to code

Footage emerges of armed police arresting Sussex student in halls after ‘threats to kill’
Police raided East Slope halls with dogs after a 19-year-old student made ‘malicious communications’

Student forced to drop out after their university was unable to fund a sign language interpreter
The Brighton student said: ‘It’s devastating. I’m trying to remain strong and positive and just try to fight it as best I can’

Applications to join The Sussex Tab’s editorial team are now open
Applications close on Sunday 16th April

Sussex University students to be given £50 fines if caught drinking on Brighton beach
Some students have already called the ban ‘ridiculous’

Here are the acts performing at Brighton Pride this year
The Grammy award-winning Black Eyed Peas will be headlining

Sussex Student Union to hold All Members’ Meeting
Here’s everything you need to know about the event

Here’s how you can support those affected by the Turkey and Syria earthquakes as a Sussex student
‘It’s upsetting to see the news whilst being so far from home’

The UCU has released all 18 strike dates for Sussex University
The 18 days of strike action will take place between February 1st and March 22nd

University of Sussex staff set to strike for 18 days this term
Over 70,000 staff at 150 universities will be striking


Your guide to Brighton’s best date spots this cuffing season
Everything you need to impress your future significant other

Meet the Sussex rugby team tackling Movember
‘It is okay not to be okay, talking to others about your struggles is not a weakness’

How to spot the signs and tackle seasonal depression as a Sussex student
With the shorter days approaching and summer officially over, it’s very common to experience seasonal depression

The student musicians taking over the Brighton music scene
On the hunt for new music? Look no further

‘One of our parties ended with someone peeing in my wardrobe’: Sussex students worst halls horror stories
From secret crushes to peeing in wardrobes, we’ve seen it all

University of Sussex lecturers will be striking for three days this month
Strikes will be held on the 24th, 25th and 30th November

We asked Sussex’s international students about their biggest culture shocks
Beans on toast advocate til I die x


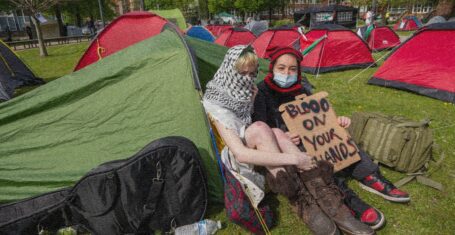
All the large-scale encampments happening at UK university campuses right now
The protestors plan to stay ‘indefinitely’ or until their demands are met

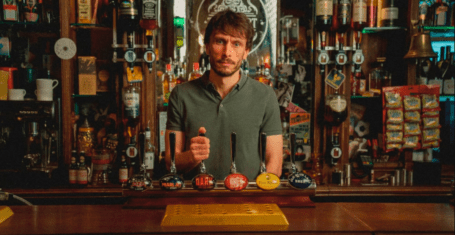
Richard Gadd has revealed which ‘disturbing’ Baby Reindeer scene was the most truthful
The scene was incredibly harrowing

The most terrifying episodes of Buffy that prove it used to be the scariest show on TV
Get that skin eating monster away from me
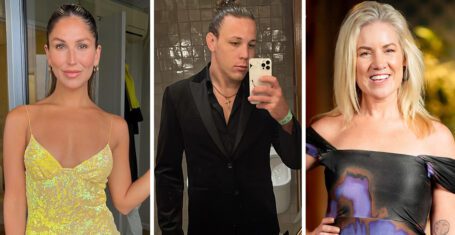
Ranked: Who from MAFS Australia 2024 gained the most Instagram followers on the show
This is what they really came for

Tim completely ‘cut off’ from media opportunities by MAFS producers after breaking contract
Executives of the show were ‘furious’ with Tim

Deleted scenes and alternate scripts: The biggest production secrets from Baby Reindeer
There’s a lot of truth being revealed

So after all the drama, who from MAFS Australia 2024 is actually still mates?
Lucinda is a common feature, of course

All the shows with 100 per cent Rotten Tomatoes ratings you need to watch after Baby Reindeer
Binged the entirety of Baby Reindeer in one day? I’ve got more for you


A release day ranking of Dua Lipa’s disappointing new album Radical Optimism
Inspired by Britpop and 90s rave culture? Where?

Baby Reindeer creator Richard Gadd is a secret millionaire raking in even more from Netflix
Umm, he has a whole other name he makes money under?
Richard Gadd reveals the reason why he banned his parents from watching Baby Reindeer
It’s absolutely heartbreaking


A rundown of all the drama between Selling The OC’s Tyler and Alex Hall and Brittany Snow
Brittany hinted Tyler was unfaithful during their marriage but Alex has snapped back

Every time the outspoken MAFS Australia 2024 cast savagely slammed the show’s producers
They have not held back at all

Ranking The Real Housewives cast by the whopping amount they’ve spent on plastic surgery
I’ve never felt so poor


Camden pubs to comedy clubs: All of the real-life locations used for filming Baby Reindeer
Probably best to avoid some of these locations
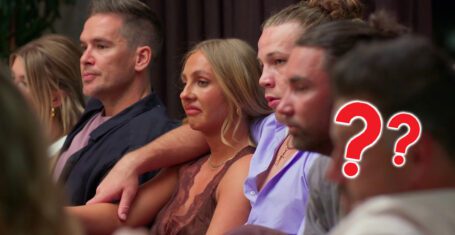
Three MAFS Australia 2024 cast members wanted to quit but stayed until the end of the show
Producers persuaded some to stay whilst others have said they still regret not leaving
Here’s where to watch Jess Gunning next if you loved her in Netflix’s Baby Reindeer
She has ironically played many police officers

You need to watch the explosive new dating show Love Triangle that makes MAFS look tame
It’s got dinner parties, arguments and cheating scandals in the first two episodes!