
Revealed: The gender breakdown of every undergraduate Durham degree, 2019-2024
A Freedom of Information request revealed the gender breakdown of all 133 undergraduate degrees at Durham

Ever wondered what the gender divide on your undergraduate degree at Durham is? The Tab can reveal the gender breakdown of 133 undergraduate and integrated masters degrees in the last five academic years at Durham University, from 2019 through to 2024.
The data was provided by Durham University, following a Freedom of Information (FOI) request by The Tab. It showcases the 2023/24 data for every degree, and depicts changes over time for each classification of degree – Bachelor of Arts (BA), Bachelor of Science/Engineering (BSc/BEng), Bachelor of Laws (LLB), Master of Biological Sciences, Natural Sciences, Chemistry, Physics, Mathematics or Engineering and Bachelor of Education (BAE).
In all classifications, students registering their gender as other make up an average of less than one per cent. Where there are a number of students identifying their gender as other, this is mentioned in each section. While The Tab does not have data on the precise number of students on each degree in each year, if all sizes were equal, female identifying students account for 54 per cent of the student body – male identifying students account for 46 per cent in this scenario.
Additionally, placement, abroad and foundation years are all covered below.
Bachelor of Arts (BA)


In 2023/24 academic year, 60 per cent of BA students identified as female, closely reflecting the five year average of 59.6 per cent. The proportion of BA students identifying as female in this period ranges from 58-61 per cent.
In 2023/24, the BA degree with the highest proportion of students identifying as female was English Literature with an abroad year, at a rate of 95 per cent. Meanwhile, the BA degree with the highest proportion of students identifying as male was Accounting and Finance with a placement year, at a rate of 75 per cent.
With the exclusion of degrees including placement, abroad or foundation years, the BA degree with the highest proportion of students identifying as female was tied between Religion, Society & Culture and Education Studies – Sociology, at a rate of 94 per cent. For male identifying students, it was Economics and Management at a rate of 67 per cent.
An average of at least 1 per cent of students identified their gender as other in the following BA degrees, from 2019-2024: Education Studies – Sociology and Philosophy & Theology.
Bachelor of Science/Engineering (BSc/BEng)


In 2023/24, 53 per cent of BSc/BEng students identified as female, a number slightly higher than the five year average of 50.4 per cent. The proportion of BSc/BEng students identifying as female in this period ranges from 47-53 per cent. Despite an overall even split, 25 of 39 BSc/BEng degrees registered a proportion of at least 60 per cent of one gender in 2023/24 – 16 female-heavy degrees, nine male-heavy degrees.
The degree with the highest proportion of students identifying as female in 2023/24 was Psychology with an Abroad Year, at 90 per cent. For male identifying students, it was Engineering (Electronic), at 92 per cent. Degrees with considerable change over the five years include Geophysics with Geology, where the proportion of female identifying students increased from 16 to 50 per cent, and Archaeology, where the proportion of male students increased from 27 to 39 per cent.
At 0.4 per cent, Physics recorded the highest proportion of students identifying their gender as other.
Bachelor of Education (BAE)


In 2023/24, 88 per cent of BAE students identified as female, slightly lower than the five year average of 89.4 per cent. The proportion of BAE students identifying as female in this period ranges from 88-91 per cent.
BAE accounts purely for Primary Education, meaning that the data provided is exclusively for this degree.
Bachelor of Laws (LLB)


In 2023/24, 70 per cent of LLB students identified as female, a rate considerably higher than the five year average of 64.8 per cent. The proportion of LLB students identifying as female in this period ranges from 60-72 per cent.
LLB students identifying as male were more likely to take the standard three year course at a rate of 39.8 per cent over the five year period, compared to 36.6 per cent on the foundation year course, and 29 per cent on the abroad year course.


Integrated Master of Biological Sciences, Natural Sciences, Chemistry, Physics, Mathematics or Engineering


In 2023/24, 70 per cent of integrated scientific masters students identified as male. This figure is exactly the same as the five year average, where the proportion of students identifying as male has ranged from 68-71 per cent.
Biosciences, with a five year average of 60.2 per cent, had the highest proportion of students identifying as female. In this time, the proportion of Computer Science students identifying as female rose from 8 to 21 per cent, an increase of 162.5 per cent.
MEng Aeronautical Engineering had the highest average proportion of students identifying as male, at 88 per cent.
With an average proportion of 0.2 per cent, Computer Science, Natural Sciences and Physics & Astronomy recorded the highest rate of students identifying their gender as other.
Placement Year


After a very male-heavy proportion of placement year students in 2019/20, a relatively even trend has settled – over the five year period, an average of 50.2 per cent of students taking placement years identify as male.
Despite an overall even split, 7 of 12 placement year degrees registered a proportion of at least 60 per cent of one gender in 2023/24 – four female-heavy degrees, three male-heavy degrees. Psychology with a placement year had 89 per cent of students identifying as female in 2023/24, while Finance with a placement year had 78 per cent of students identifying as male.
The proportion of Philosophy, Politics and Economics with a placement year students identifying as female increased from 33 to 52 per cent, and the proportion of Marketing & Management with a placement year students identifying as male increased from 19 to 31 per cent.
Abroad Year


Female identifying students were much more likely to take an abroad year, at a proportion of 60.6 per cent. One reason for this could be the requirement of languages students to take an abroad year – with the exception of Japanese Studies (44 per cent female, 2023/24), all language degrees had at least 60 per cent of students identifying as female in 2023/24.
In some subjects, however, female identifying students were more likely to opt for an abroad year. 62 per cent of Business and Management students with an abroad year in 2023/24 identified as female, despite much lower rates of 47 per cent on the three year course and 41 per cent on the placement year option. History provides another example of this, with 81 per cent of abroad year students in 2023/24 identifying as female, despite a lower number of 46 per cent on the three year course.
An anomaly to this trend is Natural Sciences, where 67 per cent of abroad year students identified as male, despite a lower number of 48 per cent on the three year course.
Japanese Studies with an abroad year recorded the highest rate of students identifying their gender as other, at an average of 0.6 per cent.
Foundation Year


There is very little trend between gender and foundation year students.
Over five years, 51.6 per cent of foundation year students identified as female, with a large range of 42-57 per cent showing considerable variation.
Data via Excel (Ben Green)
Featured image via Georgia Sanderson
Related articles recommended by this author:

Latest

The Unchosen set is real, and it used to be a hall for the Plymouth Brethren Christian Church

It’s got so much real-life history

Michael Jackson’s bodyguard and friend details ‘delirious’ final phone call before singer’s death

‘He was begging for me to come to Los Angeles’


Michael Jackson’s shocking death was actually ruled a homicide – here’s what happened

His doctor was found guilty of involuntary manslaughter


Spoiler from across the pond: I can’t wait a week, so here’s if Louie dies in The Pitt season two

It wasn’t looking good at the end of episode five

The Boys star Erin Moriarty opens up about a heartbreaking health struggle during season five
‘I started to lose the ability to walk’

Adam’s actor explains what happened to him after Netflix’s Unchosen, because he vanished
Shocker, he did not get a happy ending

The Pitt’s Noah Wyle reveals the deeper reason Robby won’t forgive Langdon, and it’s not betrayal
‘Another way of framing it is that Robby f*cked up’

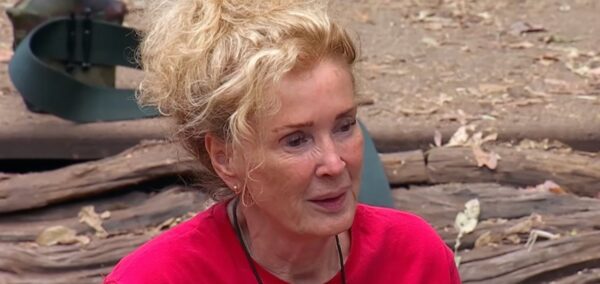
Huge net worths of the I’m A Celeb South Africa 2026 finalists Adam, Harry, Craig and Mo

They don’t need that paycheck
The sad reason Beverley isn’t at live I’m A Celeb South Africa 2026 final in London
She’s ‘absolutely gutted’

Palestinian student criticises Royal Holloway after student gets payout over headscarf comment

‘I trusted this institution with my dignity and this institution failed me’
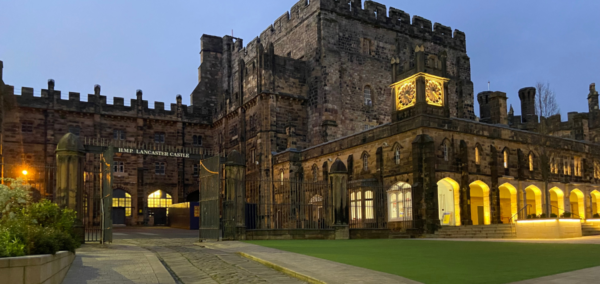
Victorian voices analysed in new Lancaster University research on northern accent development

The study has been undertaken by researchers at Lancaster University and Leiden University to understand how Lancastrian and Cumbrian accents have developed
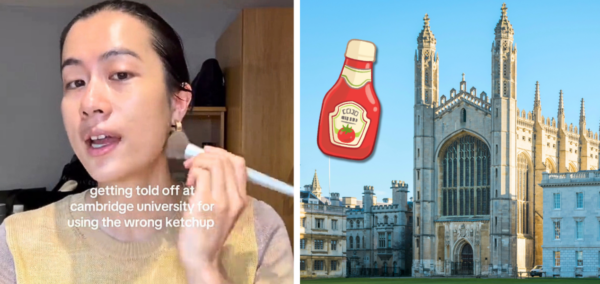
I got in trouble for using the wrong ketchup at Cambridge University

Ariana Lee shared the shocking reaction to her mistake at the fellows’ table

Here’s which Roses event you should watch to based on your Lancaster Uni college

Don’t get too offended – at least you’re not from York

Lancaster social secs: Here’s seven socials ideas for third term

Everyone knows the best socials have a theme, so here are some of our favourites

Cambridge Uni colleges not informed about investigation into professor’s sexual misconduct

Simon Goldhill, 69, was able to continue teaching despite claim he gave student an unwanted kiss

Here’s the problem with Spider-Man villains explained, after that viral Batman tweet

I’ve never actually thought about this

Calling all writers: The Bristol Tab is recruiting editors for its 2026/27 team

Applications close at 11:59pm on Friday 1st May

Here are five things Lancs students will do instead of studying

Is your go-to procrastination practice on this list?